Mortgage rates and home values have been two of the most critical factors influencing the U.S. housing market for decades. From the record-high interest rates of the early 1980s to the unprecedented lows of the pandemic era, mortgage rates have dictated affordability, buyer demand, and real estate market trends. But how exactly do mortgage rates affect home values? And how long does it take for the impact to be felt? Let’s take a deep dive into the last 60 years of mortgage rate history and its correlation with home prices.
Mortgage Rate Timeline (1965–2025)
The 1960s and 1970s: Rising Inflation Pushes Rates Higher
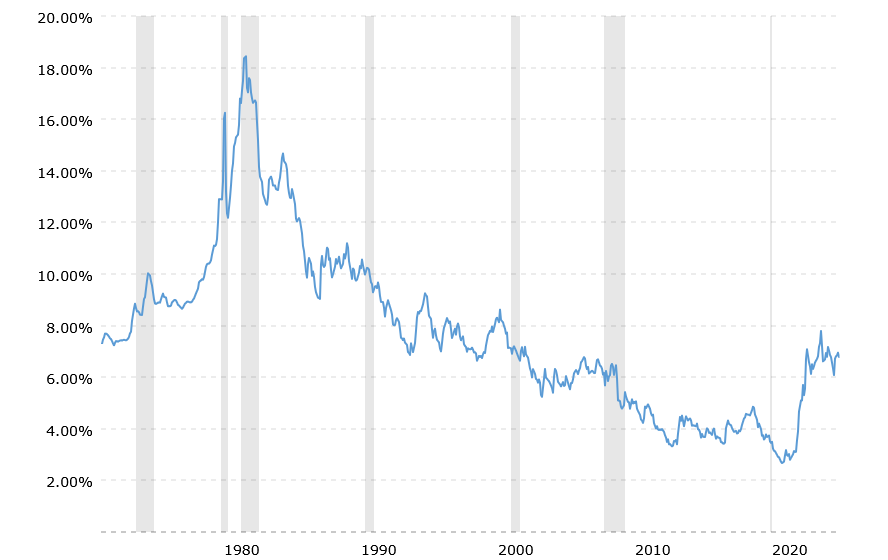
In the mid-1960s, mortgage rates hovered around 5–6%. However, by the late 1970s, inflationary pressures—caused by factors like the 1973 oil crisis and the end of the gold standard—drove mortgage rates into double digits. By 1979, 30-year fixed mortgage rates exceeded 11%, making homeownership increasingly expensive.
1981: The Highest Mortgage Rates in U.S. History
To combat runaway inflation, Federal Reserve Chair Paul Volcker raised interest rates aggressively. By 1981, mortgage rates hit their highest recorded levels—16–18%, with peaks exceeding 18%. This severely dampened home affordability and home sales.
The 1980s and 1990s: Rates Gradually Decline
After the peak in 1981, mortgage rates began a slow descent. By 1989, they had fallen below 10%, making home purchases more accessible. The 1990s continued this trend, with rates dropping from ~10% in 1990 to below 7% by 1998.
The 2000s: Boom, Bust, and Recovery
After the dot-com bubble burst in 2001, the Fed cut rates aggressively. Mortgage rates declined to the 5–6% range, fueling a housing boom. However, by 2006, rates climbed above 6.5%, helping to trigger the housing market slowdown. When the 2008 financial crisis hit, the Fed slashed rates to near zero, bringing mortgage rates down to 5.0% by 2009 and below 4.2% by 2010.

Many Homeowners Were Underwater on Their Mortgages
The 2010s: A Decade of Historically Low Rates
The Federal Reserve kept interest rates low to support the economic recovery. Mortgage rates stayed between 3–5% throughout the decade, fueling a housing market rebound. By 2016, the average 30-year fixed mortgage rate was just 3.65%.
2020–2022: The Pandemic Housing Boom and Rate Hike Shock
In response to COVID-19, the Fed again slashed interest rates, bringing mortgage rates to an all-time low of 2.65% in early 2021. This cheap credit ignited a housing boom. However, inflation surged in 2022, prompting the Fed to raise rates aggressively. By October 2022, mortgage rates spiked to 7.1%, the highest in 20 years.
2023–2025: Rates Stabilizing at Higher Levels
As of 2025, 30-year fixed mortgage rates remain around 6.5–7%, reflecting persistent inflation concerns but stabilizing from the sharp 2022 hikes.
How Quickly Do Mortgage Rates Rise and Fall?
Historically, mortgage rates rise quickly but decline gradually. For example:
- Late 1970s–1981: Mortgage rates doubled from ~8% to ~16% in just four years.
- 1981–1993: Rates took 12 years to fall back below 7%.
- 2003–2006: Rates increased from 5.8% to 6.4% in three years before dropping rapidly during the financial crisis.
- 2022: Rates more than doubled from 3.2% to 7.1% in just 10 months.
Home Value Trends vs. Mortgage Rates
While mortgage rates impact home prices, the relationship is complex:
- 1970s: Home prices surged due to inflation, despite rising rates.
- 1980s: High mortgage rates (16%+) suppressed home values, leading to stagnation.
- 1990s–2000s: Declining rates fueled home price growth.
- 2008–2012: Despite low mortgage rates, home values plummeted due to the financial crisis.
- 2020–2022: Record-low mortgage rates triggered rapid home price appreciation, with a 19.5% annual increase in Q1 2022.
- 2022–2023: Rising rates caused a significant slowdown in home price growth.
What’s the Correlation Between Mortgage Rates and Home Prices?
Studies show that mortgage rates and home prices have a weak short-term correlation (about +0.26), meaning they sometimes rise together. However, a lagged effect emerges over time:
- When mortgage rates rise quickly, home price growth slows within 1–2 years.
- Periods of low mortgage rates (2010s, 2020–2021) fuel rapid home appreciation.
- Extended periods of high rates (1980s, 2022–2023) typically lead to housing market slowdowns.
Housing Bubble
Key Economic Events That Shaped Mortgage Rates and Home Values
- 1970s Inflation: Drove mortgage rates into double digits and slowed real home price growth.
- 1981 Recession: High rates (16–18%) crushed affordability and home sales.
- 1990s Economic Expansion: Rates declined, making homeownership more accessible.
- 2000s Housing Boom and Bust: Low rates fueled a bubble; rate hikes contributed to its burst.
- 2008 Financial Crisis: Rates dropped to historic lows, but home values collapsed.
- 2020–2021 Pandemic: Record-low rates (2.65%) triggered rapid home price inflation.
- 2022–2023 Rate Hikes: Mortgage rates doubled, cooling the housing market.
Final Thoughts: Where Are We Now?
The past 60 years show that mortgage rates and home values are intricately linked. While low rates historically boost home prices, rising rates typically slow appreciation or even cause declines. As of 2025, mortgage rates remain elevated compared to recent history, but they are still well below the extremes of the 1980s.
For homebuyers and investors, understanding this historical context can help navigate the ever-changing real estate landscape. While no one can predict the future with certainty, history suggests that rate cycles—and their effects on home values—tend to repeat over time.