The Wilmington Regional Association of REALTORS uses a centralized call center for scheduling showings of homes. Not only does it take some of the work out of tracking showing times and who is accessing the home, but it also allows us to get a pretty good idea of what kind of activity each price range of homes is seeing. This can help us and our sellers create a realistic expectation for how often their home will be shown.
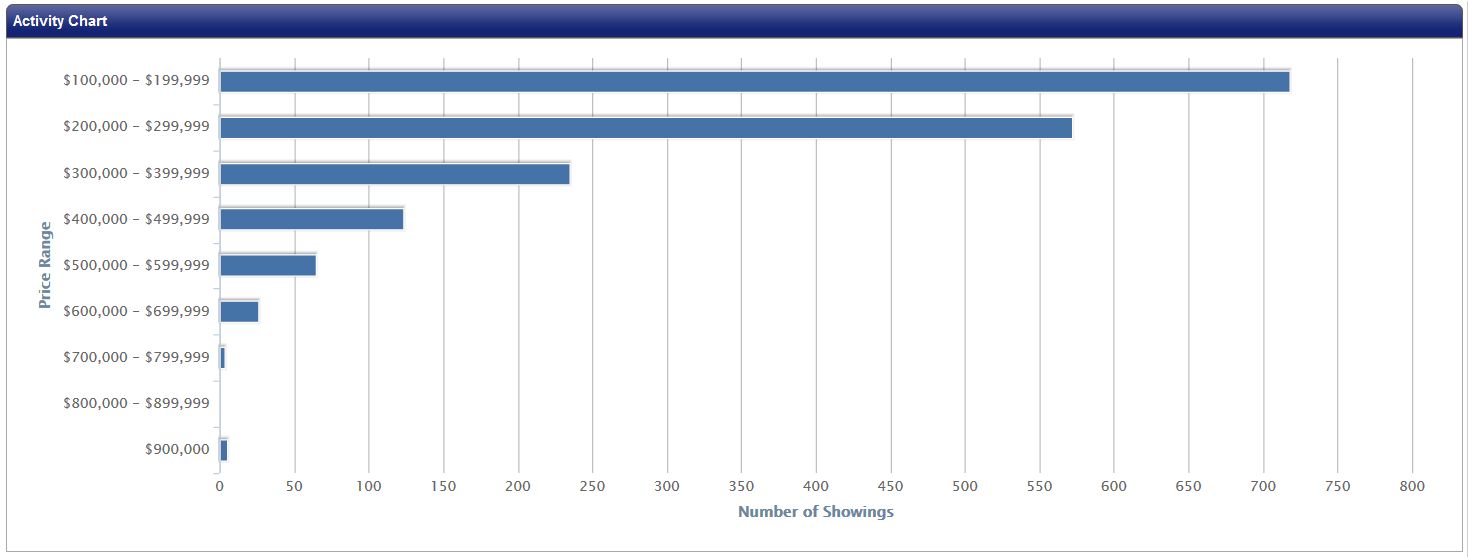
Here is the showing activity for the past month (1/18/15-2/17/15) for the entire MLS:


As you can see, the homes listed between $100,000 and $300,000 are getting significantly more showings than the other price ranges. Even homes listed in the next price range, between $300,000 and $400,000, is seeing half the showings of the first two. Is this a sign that the homes in the higher price ranges will take significantly longer to sell? Not necessarily. This data needs to be compared to the amount of current inventory and the average days on the market. If you’re thinking of your home in particular, you also need to consider how it’s priced in comparison to other similar homes on the market.
If you’ve stumbled across this blog at a later time, you can always contact us, and we’ll be happy to pull this report for a more recent timespan. We can also further narrow the report to cities and zip codes. Have a question? Let us know!


